September 4th, 2020
An Evening With AppEngine And Python3
About a month ago, I received an email with the subject, “Configure alternative cost management method(s) for App Engine projects by July 24, 2021.” After skimming it, I decided to star it in Gmail and move on with life; maybe the COVID-19 global pandemic would be over before then and this task would rise above #534,245,770,103 on my list of things to do. However, a little over a week ago I came across a blog post by a another software engineer, Dear Google Cloud: Your Deprecation Policy Is Killing You. And I realized it described (albeit a bit melodramatically) my situation, so I read the email one evening after everyone else in the house was asleep.
Since the shelter-in-place order went into effect over 5 months ago, I had adopted an exercise schedule where every other night I would go on a 5k run after 10pm so as to minimize the likelihood of encountering other people. I tried running with a mask on, but between that and the warmer temperature during the day, just couldn’t do it for any reasonable amount of time at my desired exertion level. However, given the air quality situation due to the late August California wildfire situation, I haven’t been able to keep to that schedule. So one night while trapped inside, I figured I’d look into configuring the alternative cost management method.
The email listed four mechanisms:
- Specify the maximum number of instances
- Create budget alerts
- Disable your app manually
- Disable your app programmatically
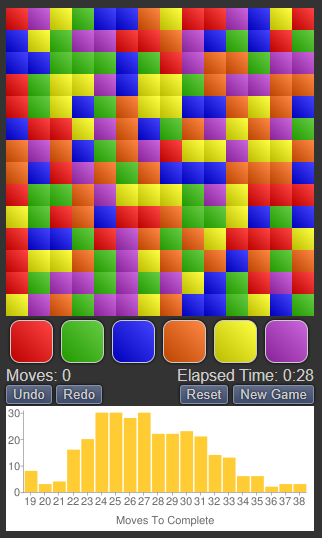
Of the three AppEngine apps I had, two could be disabled manually as one of them is not in use and the other one belonged to a Google Cloud Project that didn’t actually use AppEngine but for some reason had a default AppEngine app. The third one was legitimate, my C O L O R F L O W game.
I created that app over 9 years ago; I can’t remember why, maybe it’s because I was working at Google and AppEngine was getting close to becoming an officially supported product. Regardless, I only had to make two changes to it since. The first was to move from the Master/Slave Datastore to the High Replication Datastore (HRD). IIRC this was one of those required migrations where failing to do so by the deadline would result in the disabling of one’s app. I actually had to go through the migration process for an application at work that I volunteered time to so I remember this going pretty smoothly, though still annoying as it had only been a year since I created the application and I had hoped the promise of “platform as a service” (Paas) would insulate me from things like that.
The second time I had to make change was to move to a new AppEngine SDK and Python 2.7 (as opposed to Python 2.x). This was almost exactly three years ago, and by that time I had my act together enough to have posted my code to GitHub; based on the commits (1, 2) it looked pretty painless, though likely required digging through some documentation.
With disabling not an option, that left specifying the maximum number of instances or creating budget alerts. Alerts? Ain’t nobody got time for that. When I checked the documentation I noticed this in regard to the max_instances parameter:
Important: If you use appcfg from the App Engine SDK for Python 2 to deploy, you cannot use this parameter in your app.yaml. Instead, set the parameter as described in Setting Autoscaling Parameters in the API Explorer, or by using the App Engine Admin API.
That reminded me it’s quite a bit past the sunset date for Python 2, January 1, 2020. It was only a matter of time until I received another email notifying me of another migration date, might as well try to get that done now as well. It turns out, according to the migration guide I hit the trifecta and had work to do in order to:
- Address compatibility issues between Python 2 and Python 3.
- Deal with the fact there are no bundled App Engine services in the Python 3 runtime.
- Use a different web framework to route requests.
The compatibility issues were fairly trivial, a few iteritems() -> items(), wrapping invocations of map() in list() and using float division / and integer division // where appropriate. The lack of bundled App Engine services meant I’d have to migrate to Cloud NDB (and perhaps will have a future date migrating to Datastore Mode Client Libraries). However, first I’d have to migrate from DB to NDB…I should have known once I started pulling on this thread I’d discover it was turtles all the way down.
Fortunately since I wasn’t doing anything fancy, there weren’t many changes to go from DB to NDB and the change from there to Cloud NDB was just to use a different module import (until migrating to a different web framework, more on that later). I hadn’t written tests when creating the solver or wrapping it in a webapp. Having not made any changes in several years and working from a new laptop, I didn’t even have an AppEngine development environment setup, so it was off to read more documentation (I wasn’t willing to deploy my updated code and hope for the best).
It turns out there is a Datastore Emulator which would allow me to test the app locally with full persistence capabilities. After installing a few more gcloud and Java libraries and SDKs, I fired up the app and was reminded that the web framework I was using, webapp2, was not supported in AppEngine + Python3. So I needed to complete step #3 before being able to test things.
My choices were Django and Flask. A number of years ago I was asked to rescue an application that used Django. Given I already had the persistence layer taken care of via NDB and the number and complexity of the endpoints were dirt simple, Django seemed like overkill. I had never used Flask but after a quick scan of the documentation, it seemed like it had a template engine and a way to route requests which were the two main bits of functionality I needed. And sure enough, changing my webapp.RequestHandler classes to functions an decorating them @app.route and changing template.render(template, parameters) to render_template(template, parameters) was just about all I needed to do. all of a sudden I had an app running and raising access PERMISSION_DENIED errors, how exciting.
After some digging, it turned out I hand’t granted Cloud Datastore permissions to the colorflow-hrd@appspot.gserviceaccount.com. Once that was setup, I could play the game in my local environment and do everything except test the post to Facebook functionality (likely a domain/security issue).
The deploy to AppEngine went smoothly and everything (including the post to Facebook functionality) appeared to be working properly. I pushed a single commit to GitHub and called it a night. All in all, it took just under 5 hours. Add that to the couple of hours I spent doing the previous upgrades and it probably averages to under 1 hour per year spent on maintenance and $0 to run. Had I instead built the app using a typical LAMP stack on my webhost, I probably wouldn’t have had to do any maintenance since the PHP/MySQL software gets automatically updated and I don’t think the APIs I would have used would have changed or been deprecated, but one can never be sure.